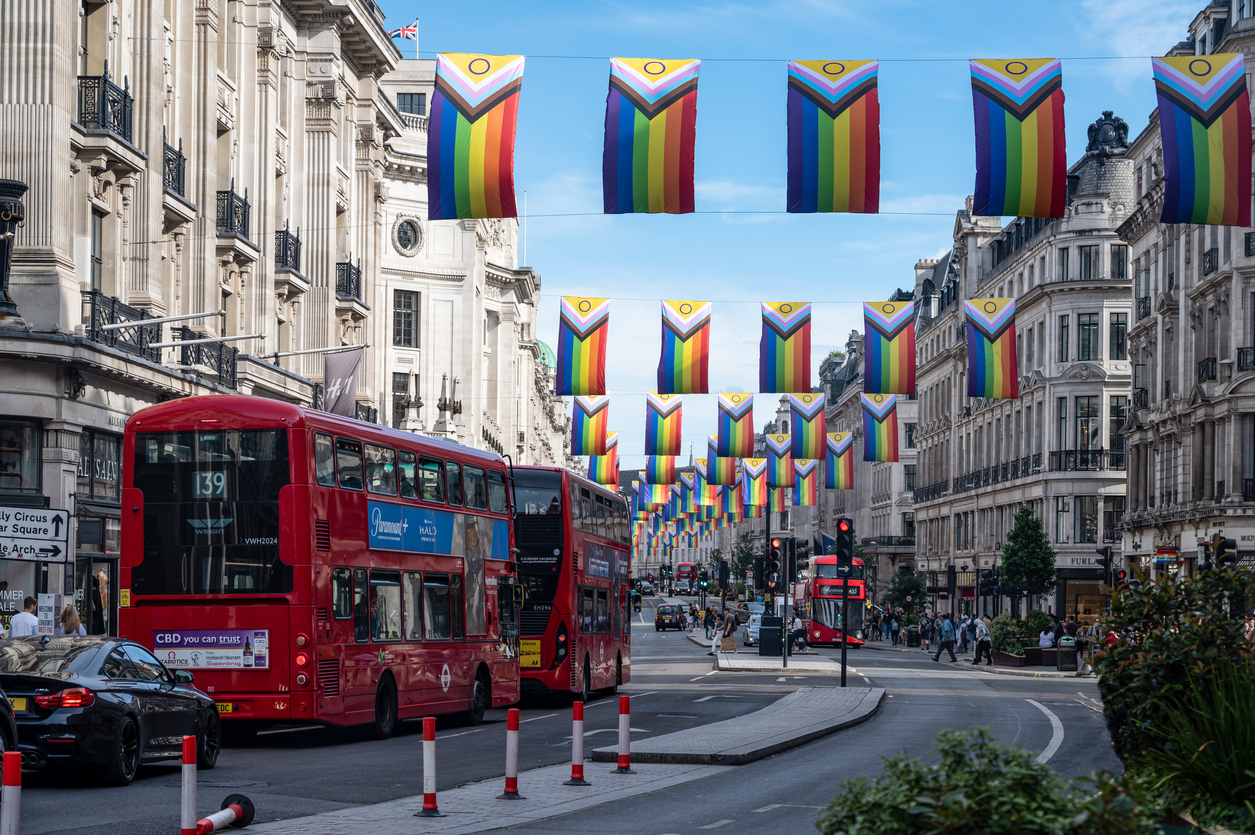
For the first time in its history, the census in 2021 asked respondents about their sexual orientation and gender identity.
Asked as a voluntary question to those over the age of 16, the aim was to provide a better understanding of the LBGT+ community in England and Wales. With richer, better quality data, government, charities and actions groups will be able to better monitor and support anti-discrimination duties under the Equality Act 2010.
In response to the question “Which of the following best describes your sexual orientation?”, 43.4 million people identified as “straight or heterosexual”. The second most common answer was “gay or lesbian” with over 748,000 people identifying this way. Over 624,000 people described themselves as “bisexual”.
Of the 165,000 people who selected “Other sexual orientation”, “pansexual” (112,000), “asexual” (28,000), and “queer” (15,000) were the most common write-in responses.


For the question regarding gender identity, 0.5%, or 262,000 people, responded “No” to the question “Is the gender you identify with the same as your sex registered at birth?”.
Those who answered “No” were given the option to write-in their gender identity. From these answers:
- 118,000 (0.24%) answered “No” but did not provide a write-in response
- 48,000 (0.10%) identified as a trans man
- 48,000 (0.10%) identified as a trans woman
- 30,000 (0.06%) identified as non-binary
- 18,000 (0.04%) wrote in a different gender identity
London was the region which had the highest number of people identifying as LGB+ and reporting their gender identity as different from their sex at birth.
Brighton and Hove was the local authority with the largest LGB+ population (10.7%). In Wales, the local authorities with the largest LGB+ populations were Cardiff (5.3%), Ceredigion (4.9%), and Swansea (3.4%).
Eight out of the top 10 local authorities with the largest proportion of the population aged 16 years and over whose gender identity was different from their sex at birth were in London, with Newham (1.51%) and Brent (1.31%) topping the list. Outside of London, the local authorities in the top 10 were Oxford (1.25%), which was third, and Norwich (1.07%), which was ninth. In Wales, the local authorities with the highest percentages were Cardiff (0.71%) and Ceredigion (0.70%).
These maps were created by Polimapper. To find out more, visit polimapper.co.uk

